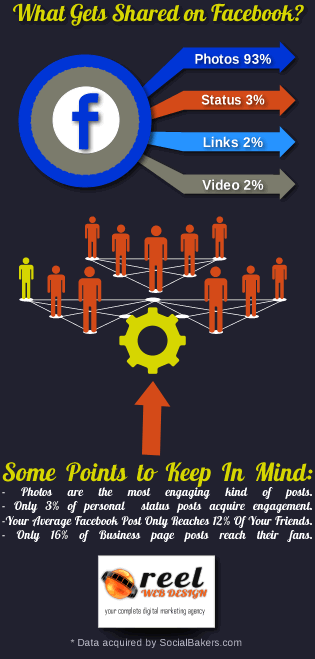
A study executed by Social Bakers shows that 93% of the most engaging posts on Facebook are photos. Their data shows that only 2% of the most engaging content on Facebook is generated by links, another 2% by videos, and 3% by status updates. Images are more engaging than ever, so get your fans engaged with strong visual content including quotes (dont forget to insert your brand), pictures from events, and of course infographics. Get visually enticing or be ignored!
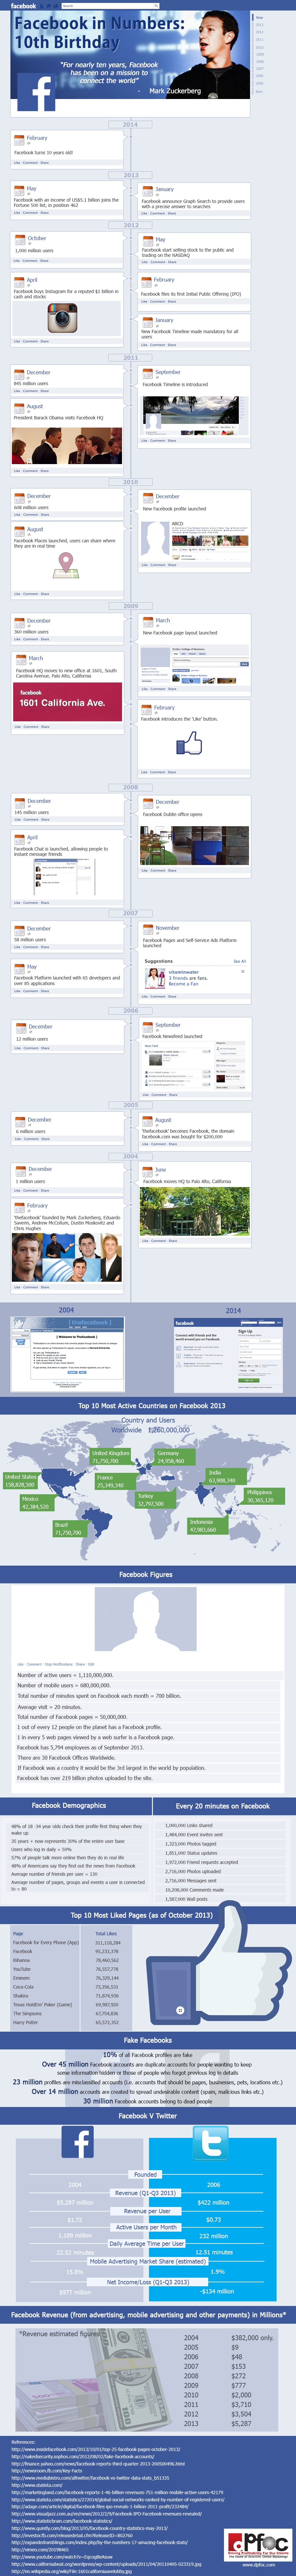
With Facebook due to turn 10 years old on the 4th February, we thought we would share an info-graphic to look back at the key milestones that the company has had throughout its meteoric rise to becoming the world’s leading social network.
Still unsure about marketing on Instagram? Have a look at this infographic sharing the latest research about Instagram marketing, that will inform and educate you about your concerns!
 A study executed by Social Bakers shows that 93% of the most engaging posts on Facebook are photos. Their data shows that only 2% of the most engaging content on Facebook is generated by links, another 2% by videos, and 3% by status updates. Images are more engaging than ever, so get your fans engaged with strong visual content including quotes (dont forget to insert your brand), pictures from events, and of course infographics. Get visually enticing or be ignored!